Polygons To Points
This tool converts geoJSON or topoJSON polygon file to the "Nodes" CSV file with
longitude and latitude coordinates of polygons centroids. Click "Submit" to download the file to your
browser's download folder.
Flow Matrix to Flow List
This tool converts a CSV file containing a flow matrix into a flow list CSV file with columns for origin, destination, and volume. Select the orientation of the matrix and click "Submit" to download the flow CSV file to your browser's download folder.
Flow Matrix Orientation
Normalize Flows
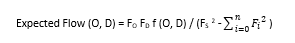
Flow normalization helps remove the effect of total flow or population size by
calculating modularity, i.e., the difference between the actual flow and the expected volume of flow for
each pair of locations (nodes). We use the adjusted flow volume formula below to calculate the expected
number of flows between locations.
For more details in modularity function please refer to Guo
(2009).
1. Select your flow file with columns: origin, destination, and volume, then click
"Submit".
2. Once processed, your file will be downloaded into your browser's download folder.
It will have columns for origin, destination, modularity, rawvolume, and expectation. The modularity
column reflects the difference between observed (rawvolume) and expected flow (expectation) using the
given formula.
3. Modularity can be negative or positive. Negative values indicate fewer observed
flows, while positive values suggest more observed flows than expected between origins and
destinations.
Calculate Node Measures
Node measures calculated from flow data facilitate the creation of custom choropleth
base map and node symbol map to provide context into the importance of nodes in the spatial network.
These measures currently include gross (total) flow, inflow, outflow, net flow,
entropy, Gini coefficients, and degree measures. Koylu & Guo (2013).
1. Select your flow file with columns: origin, destination, and volume, then click
"Submit".
2. Once processed, node measures file will be downloaded into your browser's download
folder in a csv format that contains the nodeids that exist in the flow file and the basic node measures
listed above.
3. You could join the node measure file to the choropleth or node symbol map to
customize the symbology to reflect the selected measure.
Test Server Connection (beta)
This is a testing tool to connect to the backend Java code, which will provide more
complicated analysis tools for pre-processing your data before visualization.
Only for testing use! please input your file below:
Testing result:
Video Tutorial
Tutorial Data
Example data sets are available to download and visualize with FlowMapper in the following link: https://github.com/geo-social/flowmapper.
Contact Email
About FlowMapper
Version: 1.2.3 [February 19, 2026]
Developers: Geng Tian (2020-2022), Maeve Biscupski (2023 06-10)
Supervisor/Developer: Caglar Koylu
Citation: Please cite the reference below if you use FlowMapper in a manuscript or any form of publication:
Koylu, C., Tian, G., & Windsor, M. (2023). FlowMapper.org: A web-based framework for designing origin-destination flow maps, Journal of Maps, 19:1, DOI:10.1080/17445647.2021.1996479.
| Base Map: | |
|
|
|
| Base map opacity(%): | |
| Projection: | |
|
|
|
| Title size: | |
| Title color: | |
|
|
|
|
|
|
|
|
|
|
|
|
| Reference Field: | |
| Font size: | |
| Label radius: | |
| Label color: | |
| Opacity (%): | |
|
|
|
| Upload Polygon Data: | |
|
|
|
| Fill: | |
| Join CSV Data: | |
|
|
|
| JSON ID Field: | |
| CSV ID Field: | |
| Map Field: | |
| Classification: | |
| Manual break setting: | |
| Color scheme: | |
| Min color: | |
| Max color: | |
| # of classes: | |
| Fill opacity (%): | |
| Stroke color: | |
| Stroke width: | |
| Legend title: | |
| Decimal places: | |
| Node Data: |
|
|
|
|
| # of classes: | |
| Manual breaks setting: |
|
| Fill color: | |
| Min Color: | |
| Max Color: | |
| Fill: | |
| Fill opacity (%): | |
| Radius: | |
| Min radius: | |
| Max radius: | |
| Stroke color: | |
| Stroke width: | |
| Legend title: | |
| Decimal places: | |
| Flow Data: | |
| Origin ID: | |
| Destination ID: | |
| Volume: | |
| Show top flows: | |
| Style: | |
| Classification: | |
| # of classes: | |
| Color:
|
|
| Fill opacity (%): | |
| Min color: | |
| Max color: | |
| Min width: | |
| Max width: | |
| Stroke color: | |
| Stroke width: | |
| Legend title: | |
| Decimal places: | |
Error
Error.
Error: Nodes and flows do NOT match!
Please make sure the origin and destination IDs used in flow CSV file exist in the node file. Please upload your files and select the matching ID columns.
Region Join Results
Number of features:
Number of joined features:
Number of disjoint features: